Projects
Global Sustainable Energy Analysis (2000-2020)
In this project, I conducted an in-depth analysis of global sustainable energy data from 2000 to 2020, focusing on electricity generation from renewable sources, energy intensity, and CO2 emissions across different continents. The original dataset, sourced from Kaggle, provided a comprehensive foundation for this analysis with missing data from less than 10% of countries.
To ensure data accuracy and streamline the import process, I employed Power Automate to fetch data from external sources and update the Excel workbook regularly. I also performed thorough data cleaning, removing duplicates, handling null cells, and consistently formatting the data.
Using conditional formatting, I highlighted key insights, such as cells with zero values and data patterns across continents for the year 2000. By applying formulas like INDEX and MATCH, I was able to efficiently lookup and retrieve country/continent matches for each row, enabling large-scale comparisons.
To summarize and visualize the data, I created PivotTables and PivotCharts for three selected years: 2000, 2010, and 2017. These tools allowed me to aggregate data by continent and year, and present the results for 2010 and 2017 by calculating the average for each continent and displaying the percentage of the total yielded value.
Through this analysis, I uncovered three compelling stories:
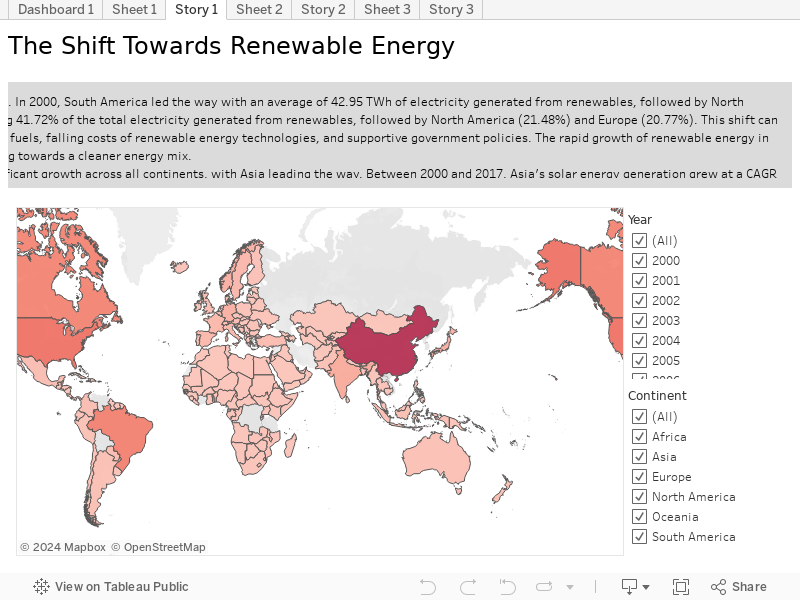
- The Rise of Renewable Energy: Examining the growth of electricity generation from renewable sources across continents from 2000 to 2020.
- Decreasing Energy Intensity: Analyzing the trend of energy intensity reduction over time and its implications for sustainable development.
- CO2 Emissions: A Continental Comparison: Comparing CO2 emissions across continents and highlighting the progress made in reducing emissions.
These stories are visually presented using Tableau, offering interactive and engaging insights into the global sustainable energy landscape.
By downloading the edited data file and appendix, you will gain access to the cleaned and formatted dataset, along with a detailed explanation of the data cleaning process, the formulas employed, and the insights derived from the analysis.
This project showcases my skills in data analysis, data cleaning, automation, and data visualization using Excel, Power Automate, and Tableau. It provides a comprehensive understanding of the global sustainable energy landscape and highlights the importance of data-driven decision-making in addressing the challenges of sustainable development.